

#
Debugging Obfuscated .NET Stack Traces with Mapping Files
A mapping file translates obfuscated type and method names back to their original names.
Use the mapping from the same protection run as the affected assembly. A mapping from another build can leave names untranslated or translate them incorrectly.
#
1. Enable mapping file generation
In Protection Settings → Obfuscation, enable Create Mapping File. From the command line, use:
-mapping_file 1Save the generated mapping file with the build it belongs to. Keep a mapping for each separately protected assembly. Do not distribute mapping files with your application.
Keep the original mapping
Running protection again may assign different names, even from the same source. Rebuilding is not a reliable way to recover a lost mapping.
#
2. Capture the full exception
Log Exception.ToString() rather than just Exception.Message. It includes the exception type, stack trace, and inner exceptions. Include a unique build ID so you can find the matching mapping.
For example:
using System;
using System.IO;

public static class ErrorReport
{
    public static void Write(Exception exception, string releaseId, string fileName)
    {
        if (exception is null)
            throw new ArgumentNullException(nameof(exception));
        if (string.IsNullOrWhiteSpace(fileName))
            throw new ArgumentException("A report file is required.", nameof(fileName));

        string report = "Release: " + releaseId + Environment.NewLine
                      + "UTC: " + DateTimeOffset.UtcNow.ToString("O") + Environment.NewLine
                      + exception;
        File.WriteAllText(fileName, report);
    }
}
Use a writable location and handle logging errors so they do not hide the original exception. Remove sensitive data before sharing reports.
#
3. Restore names with the GUI
Open the Stack Trace Deobfuscator, load the matching mapping file, paste the full exception report, and click Deobfuscate.
For example, a renamed method might appear like this:
Before: at dwljUTtBvJw26Yy6VY.ar4dgQ1a4qVJ6XQ2eq(Int32 value)
After:  at Product.OrderService.Validate(Int32 value)
For traces that include several protected assemblies, use the matching mapping for each.
#
4. Deobfuscate in your own tools
To translate stack traces in your error-reporting tools, use StackTraceDeobfuscator.dll:
using System;
using System.IO;
using Eziriz;

public static class TraceTranslator
{
    public static string Translate(string report, string mappingFile)
    {
        if (report is null)
            throw new ArgumentNullException(nameof(report));

        if (!File.Exists(mappingFile))
            throw new FileNotFoundException("The release mapping was not found.", mappingFile);

        var translator = new StackTraceDeobfuscator(mappingFile);
        return translator.DeobfuscateText(report);
    }
}
For a support service, select mappings by build ID. Do not accept mapping-file paths from customer requests.
#
What mapping files cannot restore
Mapping files restore names, not missing stack frames or source lines. Optimizations, async methods, and code transformations can change the stack trace.
Source-line information depends on matching debugging symbols (PDBs). PDBs from an unprotected build may not match the protected assembly. Mapping-based name restoration does not require shipping PDBs to customers. Keep symbols private unless a specific diagnostic requirement justifies distribution, as described in Publishing.
#
Troubleshooting
No names change: Check that renaming was enabled, the report contains renamed application methods, and the mapping matches the deployed build.
Only some names change: The remaining entries may belong to another assembly or use names that were not renamed. Use the matching mapping for any other protected assemblies.
Translated names point to the wrong code: You may be using a mapping from another build. Check which build the report came from.
#
Inspect renaming with the Debug naming convention
In Protection Settings → Obfuscation, leave Obfuscation enabled and select Naming Convention → Debug. Protect a fresh copy of the unprotected input assembly. Keep the same public-type settings, exclusions, and renaming rules as the configuration you are investigating.
The Debug naming convention adds Δ_ to original names. For example, a renamed OrderService appears as Δ_OrderService. The original name remains recognizable, while the prefix shows that renaming was applied.
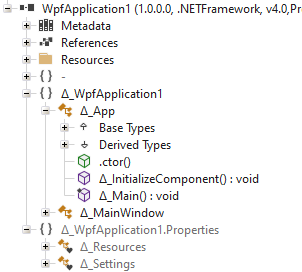
Open the diagnostic output in a decompiler and locate a familiar class or method. Check for the prefix rather than assuming that a readable name was left unchanged. A name without the prefix may have been preserved by an exclusion or public-type setting. See Verify Protected Output.
Debug names are not release protection
The Debug naming convention intentionally exposes original identifiers. Never distribute a build made with it.
This setting is separate from a project's Debug or Release build configuration. Selecting a Release build does not make Reactor's Debug naming convention suitable for distribution.
#
Debug names do not disable renaming
Δ_OrderService and OrderService are different identifiers. Code that looks up the original name through reflection, configuration, a serializer, or a UI binding can still fail with Debug naming enabled.
To find out whether renaming causes a failure, create a separate comparison build with Obfuscation disabled. Keep unrelated settings unchanged. If the failure disappears, identify the name-dependent contract and apply the smallest necessary exclusion rather than disabling renaming for the entire release. See Reflection Problems and Serialization.
#
Related topics
Mapping File · Verify protected output · GitHub Actions · Azure DevOps · Publishing